
| USA | linkedin.com/in/suresh-akshay/ | github.com/sureshaks |
|---|
About me
My name is Akshay Suresh and my educational background is in Data Science and Computer Engineering. I have always been interested in math and have been coding since I was 16.
Having worked at a highly dynamic startup like Unotech as well as a top consulting firm like BCG, I believe that impact revolves around great teams who understand collaboration, respect and are collectively willing to go the "extra mile".
As of 2025, I work at CVS Health (Aetna) as a Lead Data Scientist. My specialty lies in Collaborative problem-solving.
I am always looking forward to learn from people - people who either want to change the world or who already are...
Education and Experience
2023 - Current: Lead Data Scientist, Aetna, a CVS Health Company
2021 - 2023: Senior Data Scientist, Aetna, a CVS Health Company
2019 - 2021: Data Scientist, Aetna, a CVS Health Company
2018 : Data Scientist Intern, The Boston Consulting Group
2017 - 2019 : M.S. in Data Science, Northeastern University
2015 - 2017 : Software Developer, Unotech Software Pvt. Ltd.
2011 - 2015 : B.E. in Computer Science, University of Mumbai
Projects
Financial comment Automation, CVS Health, 2025 (Gen AI)
Context:
Financial comments are contract clauses containing instructions to process claims in free-text formatJob to be done:
How might we apply the instructions in a financial comment to a claim and come up with a recommendation?Dataset:
Internal feed of claims dataMethodology:
- Used KAG (Knowledge Augmented Generation) to create a vector representation of enterprise concepts (database.table.column) with their detailed descriptions
- Run an NER (Named Entity Recognition) on the financial comment to tag enterprise concepts
- Build a decision flow representing how these enterprise concepts react with each other
Outcome:
- A pipeline that sweeps live claims, runs them through the engine and generates recommendations
- An bot would apply those recommendations to adjudicate the claim
- Through this, we are able to automate recommendations for up to ~200K financial comments annually
Next steps:
- Piloted with a few scenarios. Expand this use-case to more financial comments
- Generalize this a pattern that can broadly apply to free-text data
Benefit Automation, CVS Health, 2025 (Gen AI)
Context:
Claims drop out of manual processing as the member benefits are complex. A human processor needs to go to the member portal, read instructions and apply the benefitsJob to be done:
How might we identify the apply the correct benefit for the claim?Dataset:
Internal feed of claims and member benefits dataMethodology:
Used a multi-step Gen AI framework to:- Identify the correct benefit on the claim
- Convert it into a structured format
Outcome:
- A pipeline that sweeps live claims, runs them through the engine and generates recommendations
- An bot would apply those recommendations to adjudicate the claim
- Through this approach, we are able to perform phase-wise expansion and support up to 0.5M claims annually
Next steps:
- Piloted with a few scenarios. Expand this use-case to more financial comments
- Generalize this a pattern that can broadly apply to free-text data
Intelligent monitoring, CVS Health, 2024 (Anomaly detection using Supervised and Unsupervised ML)
Context:
Systems adjudicate millions of claims with majority of claims processed automaticallyJob to be done:
How might we detect any unexpected changes in claim processing patterns?Dataset:
Internal feed of claims dataMethodology:
- Developed an ensemble of models like Isolation Forest, CatBoost and Baseline average to detect changes in claim processing patterns
Outcome:
A fully automated report containing anomalies along with data points needed to investigate them, such as:- Trend charts
- Secondary drilldowns by various dimensions like types of services, hospitals etc.
- Examples for detailed investigation
Next steps:
- Adjust thresholds and business rules to balance precision and recall
- Bring in data from additional sources to inform the model and potentially reduce false positives
Manual processing - RCA detection, CVS Health, 2022 (NLP, Recommendation engine)
Context:
Systems adjudicate millions of claims automatically, however, there still remains a significant volume of claims processed manually. This happens when the system does not support certain types of claims or when there is an issue that the system cannot addressJob to be done:
How might we identify and fix key contract-related drivers leading to claims dropping out of the system for manual review (drivers related to the contract setup between Aetna and the provider)?Dataset:
Internal feed of claims dataMethodology:
- A big component of manual processing involves free-text processing instructions. Used NLP techniques to templatize and cluster financial comments and hierarchical keyword matching to map them to topics.
- Created a recommendation engine that recommends alternative Auto-friendly contract setup for contract lines with higher manual volumes
Outcome:
A web application showing:- Overall manual vs auto volume
- Breakdown by contract drivers
- Breakdown by free-text topics within the contract
- Alternative auto-friendly contract setup recommendations
Next steps:
- Monitor accuracy and adherence of recommendations
- Expand from contract-specific drivers to all drivers
Contract analytics platform, CVS Health, 2021 (Cost analytics)
Context:
A price transparency law was put in effect in 2021 that required hospitals and providers to disclose their negotiated contract rates on their websites in machine readable formatJob to be done:
- How might we determine Aetna's competitive position in a given market?
- How might we use Data Science and analytics to support Aetna with contract negotiations?
Dataset:
- Internal feed of claims data
- Publicly available data across different hospitals in Excel/CSV format
Methodology:
- Developed several cost metrics to benchmark rates between different hospitals and payers
- Built forecasting models using historical claims and billing data to predict and identify hospital growth trends across Inpatient, Outpatient, Drug, and Implant services
Outcome:
- A tableau dashboard containing competitive insights for over 500 hospitals
- An application that generates a fully formatted PPT with key insights/charts and custom recommendations
Next steps:
- Build a recommendation engine that provides clear and actionable steps to improve our contracts
X-ray anomaly detection, Northeastern University, 2019 (Image processing)
Context:
Musculoskeletal conditions affect more than 1.7 billion people worldwide, and are the most common cause of severe, long-term pain and disability, with 30 million emergency department visits annually and increasing.Job to be done:
How might we build a model that helps medical professionals detect anomalies in bone X-rays?Dataset:
We used a publicly available dataset of bone X-rays called MURA (musculoskeletal radiographs). The dataset contains more than 40,000 images across 7 body parts: Elbow, finger, forearm, hand, humerus, shoulder and wrist.Methodology:
Step 1: PreprocessingAs a part of preprocessing, we performed 3 steps:
- Image resizing and rescaling to build standardized inputs
- Conversion of 3-channel RGB image into 1-channel grayscale to reduce image noise help with computational speed
- Perform adaptive thresholding for contrast adjustment (make light pixels lighter; dark pixels darker)
Our hypothesis was that anomalies would vary by body part, so we built a model hierarchy with 2 major components:
- Given the image, classify the body part (using AlexNet)
- Given the classified body part, detect anomalies (using DenseNet models for each body part)
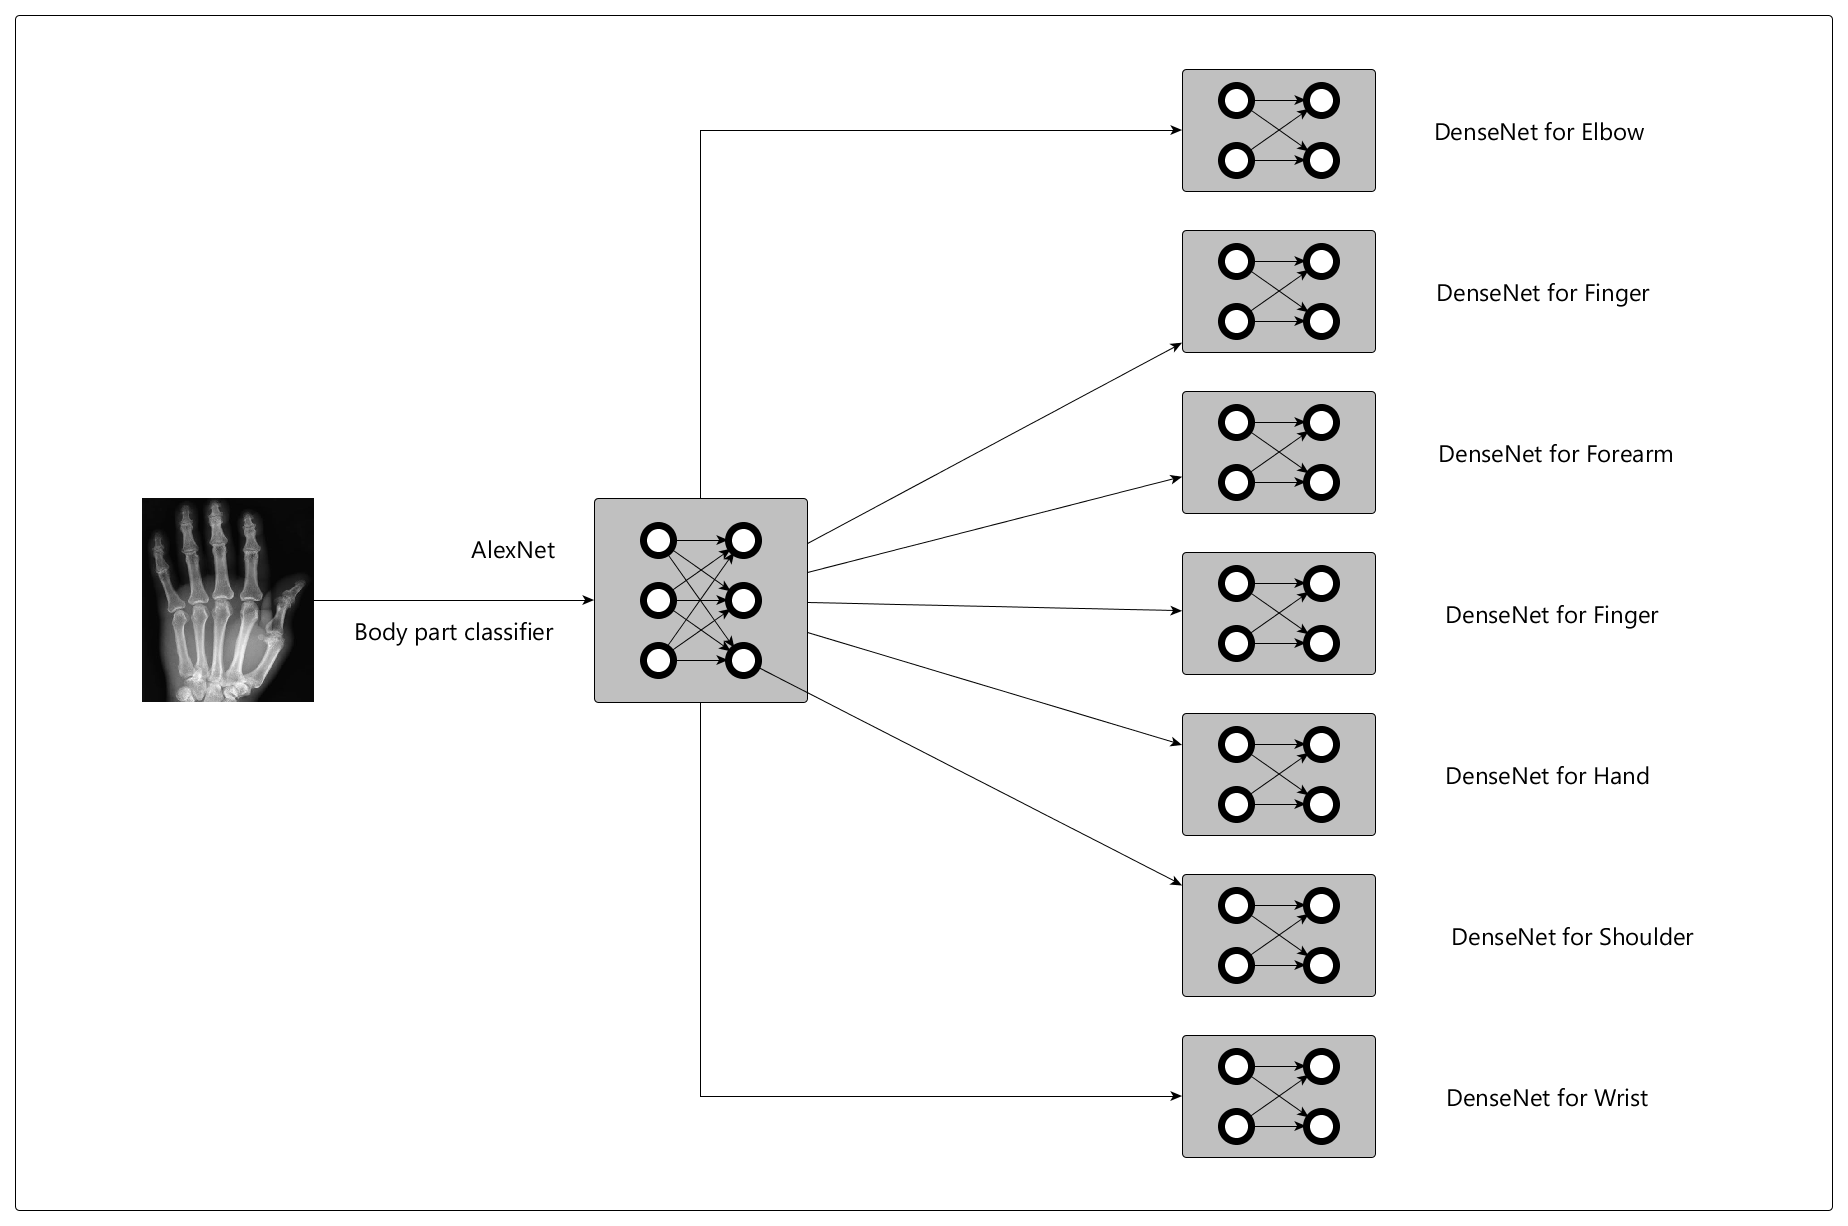
Outcome:
The body classifier performed with more than 90% accuracy across body partsThe anomaly detector had ~70% precision across body parts i.e. When our model detected an anomaly, it was correct ~70% of the time.
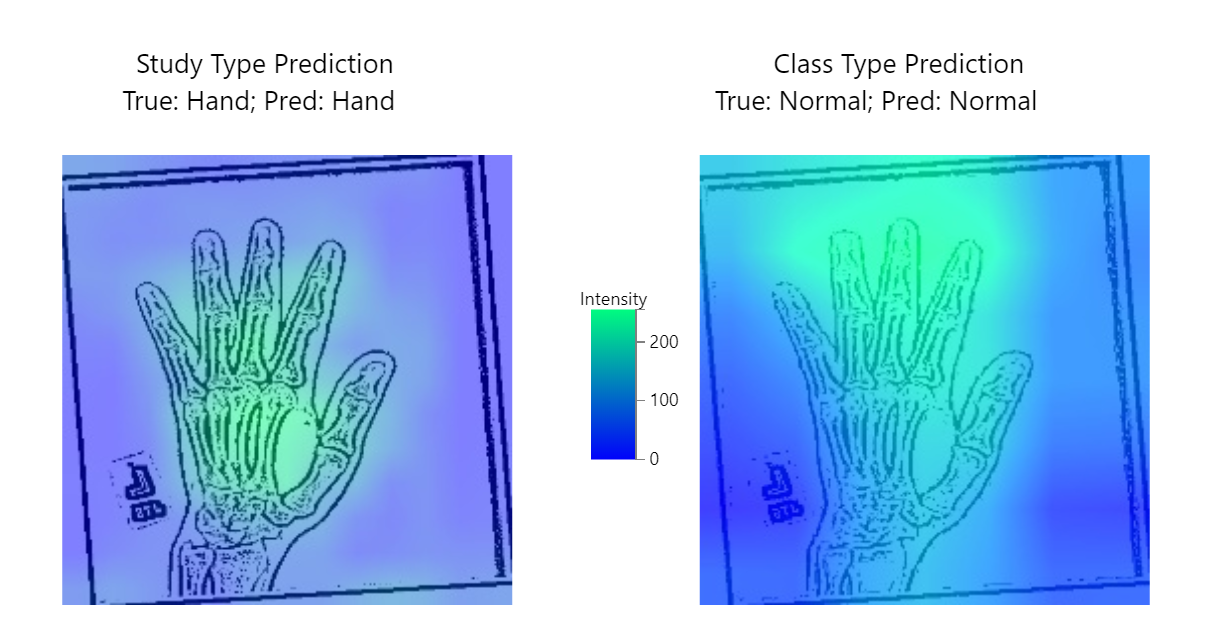
Additionally, we used a technique called Gradient Class Activation Mapping (GradCAM) to help with model interpretability. GradCAM encodes the last layer of activation to understand how the neural network learnt from the images.
Here's what it looks like (high intensity areas determine the model's prediction):
Next steps:
- Incremental development - focus on building specialized models for selected body parts that medical professionals can trust
- Experiment with sophisticated, scalable approaches to image cleaning and preprocessing
- Use GradCAM with medical professionals to understand, iterate and refine models
- Incorporate a confidence metric, so medical professionals can adjust next steps based on high vs low-confidence predictions
Blindness detection, Northeastern University, 2019 (Image processing)
Context:
Diabetic retinopathy is a condition that affects the blood vessels in the light-sensitive tissues called the retina. People with all types of diabetes are at risk of this condition. Millions of people suffer from diabetic retinopathy, the leading cause of blindness among working-aged adults.Job to be done:
How might we help with detecting risk of blindness through diabetic retinopathy before it happens?Dataset:
Large dataset of retina images taken using fundus photography under a variety of imaging condtions. This data set is available on KaggleMethodology:
Our training data consisted of a little more than 3500 images of various resolutions and sizes. The preprocessing primarily involved:- Rescaling and standardization
- A technique called Contrasted Limited Adaptive Histogram Equalization for Image Enhancement
- AlexNet: a convolutional neural network (CNN) famous for winning the 2012 ImageNet Large Scale Visual Recognition Challenge
- VggNet: a series of deep convolutional neural networks known for using small, 3x3 convolutional filters to achieve greater depth and high performance on image classification tasks
- Deep FishNet: A model using the Fishnet architecture - a versatile backbone network that preserves high-res information and specializes in classification tasks
Outcome:
All models performed with an F1-score of > 0.9, however Deep FishNet outperformed AlexNet and VggNet with an F1-score of 0.96Next steps:
- Build an interpratibility layer using techniques like GradCam to help iterate and refine the model if needed.
- Build a confidence metric to build trust with medical professionals
- Wrap the model around an API, so it can be used as a service
Libraries
Rcane
Rcane which is an implementation of different gradient descent algorithms used in regression models.
d3-charts
D3-charts is a higher abstraction to embed basic graphs and charts in web pages using d3.js.
CaraML
CaraML is a machine learning library containing simple and intuitive implementations of various machine learning algorithms.